An Instrumentation Story (How I Learned to Love the Elastic Stack)

in which we discover a better way to meet our customer's needs while showing us where we can improve our code
When you're operating a hosting service it's essential to know what's going on. Visibility into your environment is required, both on a macro scale (performance graphs) and on a micro scale (request logs). Analyzing those request logs can provide you with details hidden by the big picture.
We have a few customers that are outliers in terms of how they use Discourse; their data size might scale out in one particular direction (such as millions of users or a large number of categories) in a way that we don't expect. We've worked with them to ensure they don't accidentally DOS themselves by sending too many expensive requests via the API, which has caused us to temporarily revoke their API key on their site in response to overloading their resources in a particular way. It's intrusive and we don't like doing that - we consider that to be less responsive than we ought to be.
During the discussion with one particular customer about their API usage, we were asked:
Are you able to provide more details so we might be better equipped to understand what might have happened (e.g., time window, quantity of requests, how many requests per API key, requested endpoints, etc.)?
That's an ENTIRELY SENSIBLE question to ask of us, and with Kibana we're easily equipped to provide an answer! Let's work through how to get there together.
On top of the usual information about the request (hostname, remote IP) the Discourse backend adds information about the Ember route used and the CPU processing time taken into response headers:
X-Discourse-Route: list/latestX-Runtime: 0.370071
which are then captured by our front-end haproxy. The resulting data is fed to logstash along which massages it and injects a document into Elasticsearch. It's fantastic having this information in Elastisearch, but when you have millions of log entries, what's the next step? How do you analyze? What do you look for?
To start, I've created a new visualization and chosen to work with an entire day's data (actually: a subset of data across one hosting centre).
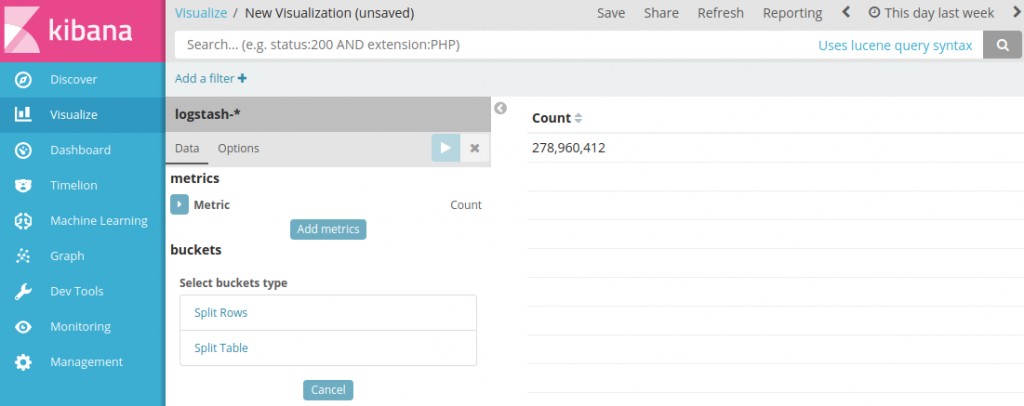
My starting screen is not that interesting but it's still summarizing 279 million documents, comprising syslog entries, nginx logs, application logs and haproxy logs. Let's pare that down a bit with a filter:
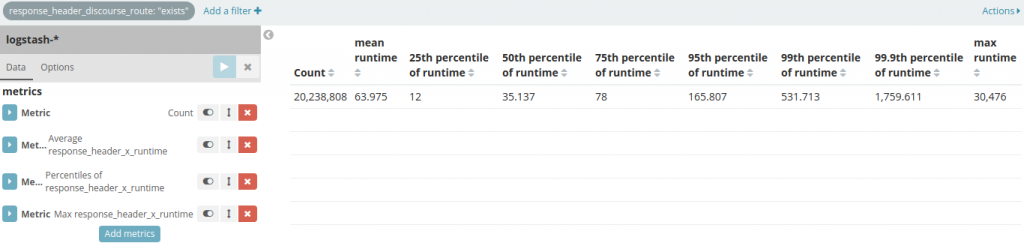
_exists_:response_header_discourse_route
so that we only look at the documents relating to requests that actually hit our application. At the same time let's add some more metrics that do some statistical analysis on our X-Runtime header value (reminder: this is in milliseconds) so we can gain some insight:
Naturally, we don't care about EVERYTHING blended together so at this point it makes sense to aggregate statistics along a dimension (for you SQL users out there, this is a GROUP BY) to tease out the variability across types of requests:
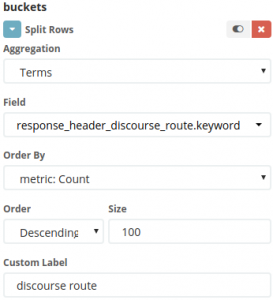
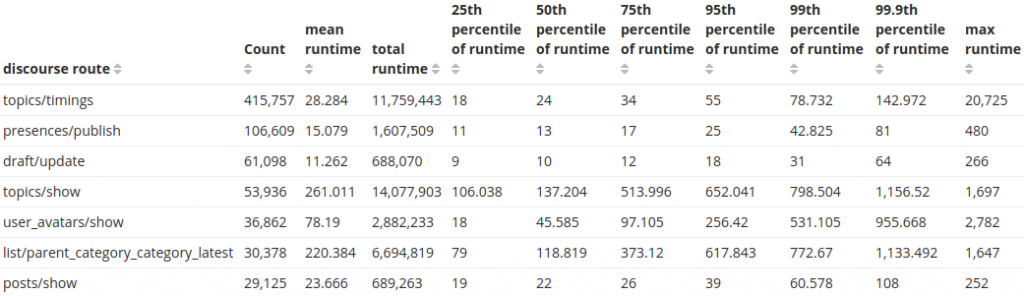
And here's where we start to see something interesting about those requests:
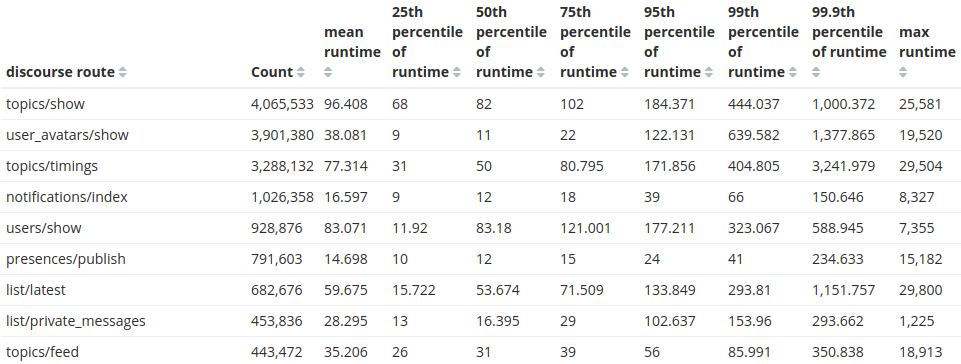
As expected, the most common request to Discourse is to show a topic. Fantastic! But let's focus and dig into our original mission to find out information about a particular customer. I've restricted the record search to only their site and added a new metric: the total runtime taken for that route.
Restricting the search to only those requests with an API key, we arrive at the answer to the question asked by our customer:
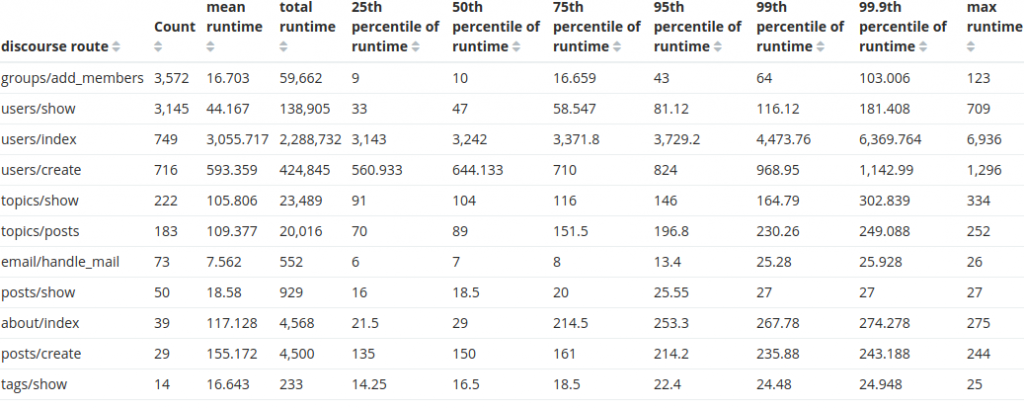
That outlier route users/index route is always expensive. Something is probably be improved there. How expensive is it for other customers?
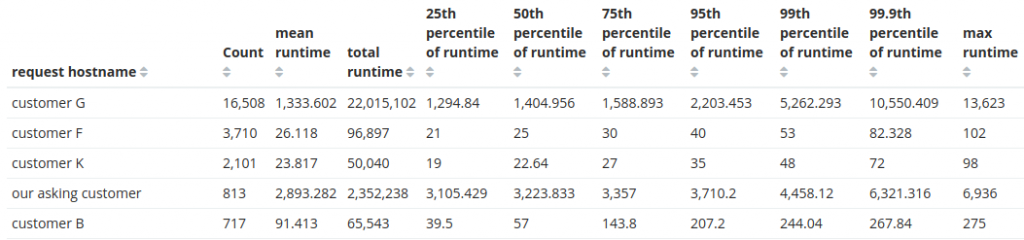
Just processing the requests for this single API route for Customer G is consuming 6 hours of CPU time per day. What is going on, and why is this so expensive?
A quick dig reveals the users/index route is an admin-restricted route that handles a search for users, filtering on username and email. This requires two full table scans to complete. Our asking customer has a lot of users in the system which stresses this particular query.
The fact that this route was being called often (and was so expensive) led us to investigate why it was being used. Quckly we discovered a gap in our API as customers had a need that wasn't being met by our design. Their workflow looks roughly like this:
- sync a user details
- look up a user by email address:
https://discourse.CUSTOMER.com/admin/users/list/active.json?api_key=KEY&api_username=sync&email=USER@aol.com - check returned users to identify one with an exact email match
- perform an operation on that user (e.g. add/remove from groups, update user information)
We addressed this by modifying our API in two ways:
- Use the column index to shortcut the logic: if there is an exact match in the email column, return only that user (commit)
- Add a new API call that requests only an exact email match and isn't interested in anything else (commit)
These changes (as it turned out, mostly the second one) significantly reduced the time spent on these queries.
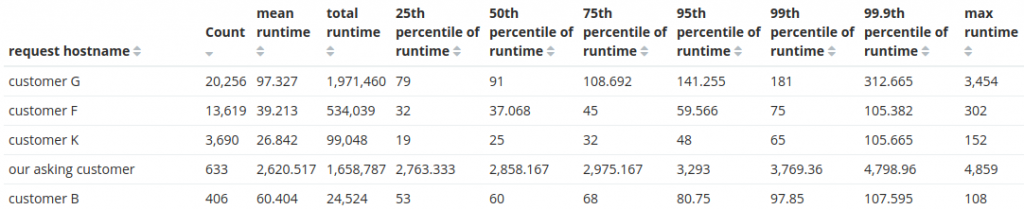
That's a MASSIVE savings of 92.3% for us when handling these API calls from Customer G since they switched to using email= as a filter - more than 5.5 cpu-hours per day of savings just for a single site.
Read more about the Elasticsearch stack at https://www.elastic.co
Many thanks to Jamie Riedesel, reading her article on Getting started with Logstash helped me understand the injest pipeline.
Comments