Who's at Fault: Tracking Down Segfaults in Production

Within complex applications and hosting environments, segfaults can manifest themselves in a myriad of weird and wonderful symptoms. For Discourse the application, this may be a notification email failing to send, or an uploaded image failing to be optimized, or many other not-very-noticeable problems.
In some cases, subtle bugs causing a program to crash due to a segfault may not always be obvious because of fault-tolerance built in to service operation; such as containers automatically being restarted on exit. This is why monitoring is critical for identifying and tracking down the cause of segfaults to prevent those weird symptoms from hanging around until someone happens to notice a service failing due to a segfault.
The anatomy of SIGSEGV
It's probably best to discuss some more detail of what a segfault is. According to POSIX.1, a segfault - or Segmentation Fault - is a signal (SIGSEGV) produced when a program generates an invalid memory reference. The offending process is signalled with SIGSEGV. The name SEGV stands for 'segmentation violation'.
Here's an example of an illegal operation that will cause a segfault on a Linux system written in C. This example is caused by dereferencing a nil pointer.
#include <stddef.h>

int main(int argc, char *argv) {
        const char *msg = NULL;
        char c = *msg;  // dereference of NULL pointer
}
Let's run the program.
$ gcc -O0 segfault.c -o segfault
$ ./segfault
Segmentation fault (core dumped)
This kind of segfault is very easy to cause when writing programs that deal with memory pointers directly such as C. The Discourse application backend is written in Ruby, and many Ruby gems include extensions written in C. Even with very careful memory management, introducing bugs that inadvertently result in segfaults under certain conditions can happen.
SIGSEGV is one of several signals that result in process termination as well as a core being saved (more on cores next). Whilst it is possible to catch this signal with a signal handler, typically there is no safe way for a process to recover and return to normal operation.
One reason for this is that on return from a signal handler, the process resumes at the same point that was executing prior to being interrupted by the signal. In the case of a segmentation fault, this will ordinarily result in the same signal being generated and the signal handler being called again, and so on.
You could however use a signal handler to clean up temporary resources such as files on disk prior to exiting the program. Only a subset of functions can be called safely within a signal handler as they are async-signal-safe as defined by POSIX.1. See signal-safety(7) for more information. Note that unlink(2) is listed as async-signal-safe.
Getting to the core of the fault
A core contains a memory dump from the process at the time of termination by the kernel. The actual data included in a core differs between platforms, but by default on Linux the following memory is included:
Dump anonymous private mappings.
Dump anonymous shared mappings.
Dump ELF headers.
Dump private huge pages.
You can find information about your platform in the core(5) manual. A core file by default in Linux is saved in the current working directory of the process.
There are several signals that will cause a core to be produced. Here is the list from signal(7) (with some extra information elided):
Signal    Comment
──────────────────────────────────────────────────
SIGABRT   Abort signal from abort(3)
SIGBUS    Bus error (bad memory access)
SIGFPE    Floating-point exception
SIGILL    Illegal Instruction
SIGIOT    IOT trap. A synonym for SIGABRT
SIGQUIT   Quit from keyboard
SIGSEGV   Invalid memory reference
SIGSYS    Bad system call (SVr4);
          ee also seccomp(2)
SIGTRAP   Trace/breakpoint trap
SIGUNUSED Synonymous with SIGSYS
SIGXCPU   CPU time limit exceeded (4.2BSD);
          ee setrlimit(2)
SIGXFSZ   File size limit exceeded (4.2BSD);
As typical of the Linux kernel, there are methods for configuring many options around what is done with core files. Some examples are: what memory segments are stored in a core, the file size limit, where a core should be saved, what it should be named; and many more. I'll be focusing on configuring the kernel to send a core to a user-defined program, and how we've utilised this on our hosting at Discourse to monitor any segfaults occurring across our infrastructure.
Since Linux 2.6, the kernel exposes a setting in the proc filesystem at /proc/sys/kernel/core_pattern (or sysctl kernel.core_pattern) which can be used to modify how a core file is named. This functionality was extended in Linux 2.6.19.
From the core(5) manual:
Piping core dumps to a program
  Since kernel 2.6.19, Linux supports an alternate syntax for the /proc/sys/kernel/core_pattern
  file. If the first character of this file is a pipe symbol (|), then  the  remainder
  of the line is interpreted as the command-line for a user-space program (or script)
  that is to be executed.
This can be leveraged in many ways! In our case, we wanted to use this functionality for monitoring segfaults. It was important that the solution needed to work for both containerised processes and those running in the initial namespace.
Thankfully, this is the case:
The  process  runs in the initial namespaces (PID, mount, user, and so on) and
not in the namespaces of the crashing process.
Let's take a look at the core_pattern we ended up with, and then the simple program that processes the core.
$ cat /proc/sys/kernel/core_pattern
|/usr/local/sbin/process-core %h %s %E
Breaking down the different components:
- The first part
|/usr/local/sbin/process-corespecifies the user-space program to which then the kernel will execute and send the core via stdin. Note the first character is|which tells the kernel that/usr/local/sbin/process-coreis the user-space program. - As you may have guessed,
%h %s %Eare template specifiers to be replaced at execution time:
%h  Hostname (same as nodename returned by uname(2)).
%s  Number of signal causing dump.
%E  Pathname of executable, with slashes ('/') replaced by exclamation marks ('!') (since Linux 3.0).
- We can use the hostname
%hto identify which host the segfault occurred on, as well as which container the segfault occurred in as container hostnames are preserved. - The signal number
%sis important, because as mentioned earlier, there are many signals which cause a core to be produced and we want to only alert on specific signals. - The pathname of the executable is the final piece of information that helps narrow down what was running when the process was terminated. The ordering is important, as the pathname of the executable may contain spaces on kernels older than 5.3.0.
The process-core script isn't included here but it is quite simple:
- Copy the stdin stream to a file on disk
- Increment a counter metric in Prometheus for the 4-tuple (hostname, program name, signal, core exists)
A wild segfault appears!
We utilise Prometheus and Alertmanager heavily across our infrastructure for monitoring which are very powerful and flexible tools. The alert for segfaulting processes, given the metric detailed above, looks like coredump_process_count{signal=~"SEGV|ABRT"} > 0. Or in other words: "if any metrics exist that received at SEGV or ABRT signal, fire this alert".
When we first implemented this alert, we didn't know what to expect. After all, how often do we really think programs are crashing and we don't know about it? At first, the alert didn't fire for a few days... until all of a sudden we had many (50) alerts firing over a short period, so something was up.
Narrowing down the culprit, a real-world example
At Discourse, we consume all alerts via our internal Discourse forum. This is an ideal workflow for us, as we can collaborate on any alerts that occur as a team, and we keep historical records for all types of alerts which is very helpful for debugging issues in the future.
Here is an example alert topic, for the segfault issue mentioned:
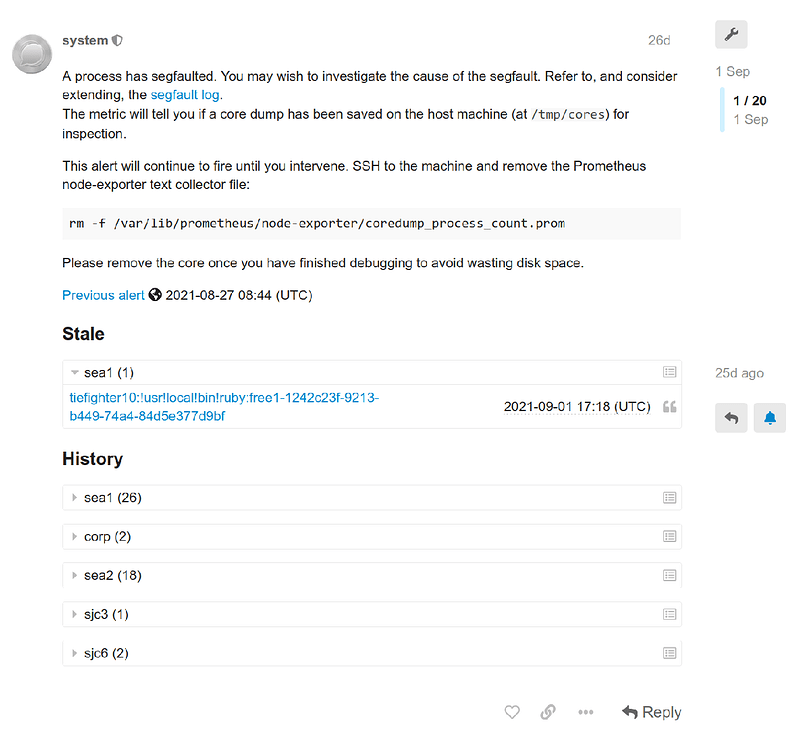
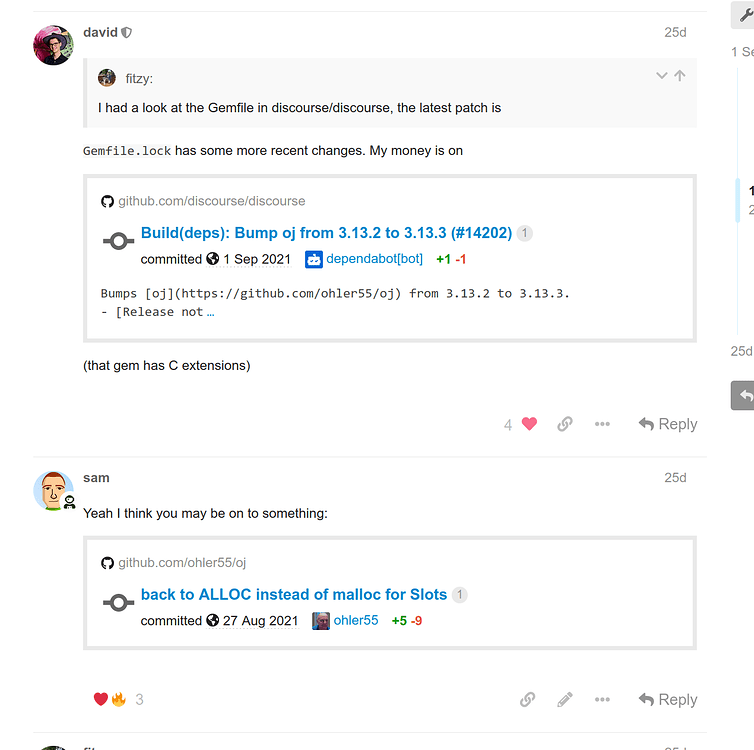
The first thing to check was what process was causing the alert to fire. In this case, the metric reported !usr!local!bin!ruby as the offending process. Given that information and the hostname being that of an application container, it was obvious the segfault was coming from somewhere with the application. Looking through the changelog, the only stand-out culprit was a bump in some gem dependencies. Given gems often come with C extensions, this was starting to be suspicious.
After rolling back the change in gems and deploying, the segfault alerts ceased firing. At this point, we were happy the problem had been resolved but wanted to go one step further and debug the issue for a more helpful issue report to the upstream maintainer.
Given we had access to a core dump, I reached for the wizardry that is gdb for debugging where the segfault may be coming from. In order to debug the core, we need to run Ruby under gdb within a similar environment that the crashed process was running in, including the gems and C extensions and other resources.
We can do this within a container based on the image that the Ruby process was running in, with gdb installed and the core file copied into the container:
# Inside the container for debugging
root@2dc12f5358fb:/# apt update && apt install --yes gdb
root@2dc12f5358fb:/# gdb $(which ruby) corefile
Note that for gdb to work, the container will need to have the SYS_PTRACE capability, which you can add with --cap-add=SYS_PTRACE at run time.
Once this is loaded, you’ll see a (gdb) prompt. Usually you’ll want the backtrace, which you can print with the bt command; I've only included a portion of the lengthy backtrace:
(gdb) bt
#0  __GI_raise (sig=sig@entry=6) at ../sysdeps/unix/sysv/linux/raise.c:50
#1  0x00007fbe5f3ed535 in __GI_abort () at abort.c:79
#2  0x00007fbe5f9d375b in die () at error.c:664
#3  rb_bug_for_fatal_signal (default_sighandler=0x0, sig=sig@entry=11, ctx=ctx@entry=0x7fbe12011ac0, fmt=fmt@entry=0x7fbe5fc69f8b "Segmentation fault at %p") at error.c:664
#4  0x00007fbe5fb9243b in sigsegv (sig=11, info=0x7fbe12011bf0, ctx=0x7fbe12011ac0) at signal.c:946
#5  <signal handler called>
#6  locking_intern (c=0x7fbe5952f710,
    key=0x7fbddd93607e "wiki\":false,\"reviewable_id\":null,\"reviewable_score_count\":0,\"reviewable_score_pending_count\":0,\"topic_posts_count\":2,\"topic_filtered_posts_count\":2,\"topic_archetype\":\"regular\",\"category_slug\":\"android"..., len=4) at cache.c:210
#7  0x00007fbe5f0640aa in oj_calc_hash_key (pi=<optimized out>, parent=<optimized out>) at strict.c:47
The segfault looks to occur with the oj_calc_hash_key function. OJ is an optimized JSON parser for Ruby and was on the list of reverted gem updates which seemed to have triggered the alerts earlier.
This debugging resulted in this issue report and the fix was merged only a few days later. Very fast work by the OJ maintainers!
Without the tooling implemented and integrated into our alerting system, the symptoms of this segfault would probably have gone unnoticed or resulted in vigorous head-scratching for days due to the location of where the segfaults were occurring. Instead, we were able to identify and roll out a fix within a couple of hours.
This reinforces for us here at Discourse how important it is to closely monitor internal services running on our infrastructure and act quickly when alerts occur. It's great to be able to provide feedback and contribute to the many open source projects we benefit from as well.
Comments