A Strategy For Making the Most of Community Health Metrics

Community health metrics can be overwhelming and trying to track everything is probably not going to deliver the results that you are hoping for. So which ones should you choose and how do you use them to your best advantage?
I am going to share something rather embarrassing with you…
Earlier in my career I had a somewhat tumultuous relationship with data. I would see my colleagues, friends and peers all obsessing over tracking literally everything they could find that related to their work.
I thought it was weird. They seemed to revel in measuring every conceivable element, and all I could think about was how exposed they would be if they screwed something up.
Gulp.
Of course, I was wrong… or rather, I was insecure.
My fear of data was really my anxiety rearing its ugly Stranger Things inspired head and it took an embarrassingly long time for me to realize that good data generates the opportunity for great improvements in our communities, in our careers and in our lives…
…but hold your horses there, dear reader.
There is a dark side to this data love-fest: people often try to measure too many data points at the expense of truly understanding the more valuable few.
Here’s the deal. Data is not the most important piece of the puzzle.
Data is the number or trend (and can be very valuable indeed), but this number or trend should be a conduit that generates ideas to drive improvements.
Data should provide an insight that gets us thinking. “Based on this data, what if we made change X to improve how our community is functioning?”
One data point I often use in Discourse is page views.
Given that 1 in 5 community members are typically actively posting in a community, page views captures both contribution and consumption, which is a good combined overall metric of community health.
I generally shoot for a 10% month-on-month increase in page views. This metric (10%), combined with this target (page views) gives clarity over not just what we want success to look like, but more importantly, if we are not hitting a target then it tells us that something else may be a cause. This might be a lack of promotion, content that isn’t interesting enough, or something else completely.
With just this one metric, there is a lot of opportunity for insight, discussion, and analysis and it is all worthwhile because our target metric (page views) is a good representation of the overall growth of our community.
The problem is when people track 50/100/200 metrics. When you do this there is no conceivable way you can have thoughtful evaluation, insights, and analysis on every one of those things (unless you are some kind of community superhero).
Now, I know what you are thinking. There are loads of reports and data points in Discourse…so which ones do I choose?
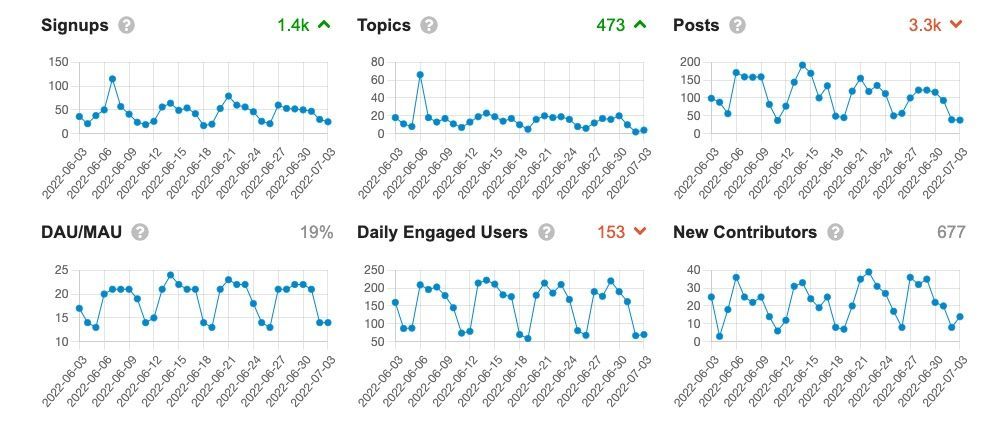
The ones that I would opt for are:
- Page Views
- Signups
- DAU/MAU (stickiness)
- Likes
- Accepted Solutions
Focus on those five data points – really tease them apart and try to peer into their souls to discover what they are telling you. If you do this right they will offer incredible insights into what your next 3 steps should be.
Good luck!
Jono Bacon is a leading community strategy and execution consultant, author of People Powered, and creator of the FREE Community Ignition Workshop as well as the Zero To Community Masterclass.
Comments